The Skinny
You’ve got some Solar Panels. You’ve got some power. And you thought that would be enough. What don’t you have? A way to watch your power throughout the day.
The Build
Materials
- An RJ12 cable (phone cable with 8 pins). Also see if you can find one of these cables at Goodwill first.
- DB9 breakout
- A serial to USB cable
- A Pi or other computer to connect the serial cable to
- Some beer
Creating a Serial Cable for Renogy Rover
Now prior 2020 Renogy supplied a RJ12 cable to USB cable with their charge controller. I was not that lucky and the unluckiness does not end there, because their serial port uses a custom pinout for communication and the next paragraph will go over how we create our own. All thanks goes to smart folks at the Renogy support forums.
For the RJ12 cable, the forum post recommends a multimeter just to make sure you don’t connect either 15V pins instead of the data pins. The pin out is TX, RX, GND, GND, +, +. You still may want to make sure that’s not flipped. TX to RX or GND will give you around 5.66V. RX to GND will be a very low non-zero value. You can always be sure that the 2 middle pins are both ground, but make sure to check the outside ones.
So with that in mind, we will be connecting the RJ12 cable to the DB9 breakout. We will be connecting pin 2 (TX) on the breakout to RX on the RJ12 cable, pin 3 (RX) on the breakout to TX on the RJ12 cable and pin 5 on the breakout to ground.
Then connect this RJ12 to the charge controller and the DB9 breakout to the serial port to USB adapter to the Pi.
@TODO Pic of DB9 chords
Sending to Grafana
For this portion I used the Solar Thing library by Wild Mountain Farms (primarily written by RetroDevil). It’s a great program written in Java and it displayed everything I wanted to do with my charge controller. RetroDevil saved me an immense amount of time and really all thanks for this guide should be given to them.
Grafana
I won’t go too deep into this so checkout their guide. I used docker on a server I rent, but you can use your pi for this if it’s a newer pi with the proper CPU and RAM.
InfluxDB
You will need to setup your own InfluxDB server and it will need to be able to communicate with Grafana. We will be sending the data from the Pi to the InfluxDB which could be running on your Pi if you so choose.
When you have the database setup, you will then connect it as a datasource in Grafana via “Configuration > Data Sources” like so.
@TODO pic of grafana data source
Setting Up SolarThing
First I would check the quickstart guide, but I will do a quicker rundown here. You will need Java installed as well.
Clone the repo and add your user to some groups.
1 | git clone --depth=1 --single-branch https://github.com/wildmountainfarms/solarthing |
Navigate to the proper charge controller in the program directory. If you are using a Renogy Rover like me it will be program/rover. We will be changing and adding a file in this directory. Copy the base templates to make this even quicker.
1 | sudo should not be required unless permissions were not set up correctly (add yourself to the solarthing group) |
Edit base.json. Adding a serial portion and a database portion to then push up the data.
1 | { |
Edit the config/influxdb.json with your database settings.
1 |
|
Finally running it. You’ll find a run.sh within the program directory you are in.
1 | ./run.sh |
if all goes well you should be sending data to your InfluxDB server and ready to start graphing within Grafana.
This library is so good, you can even test without having the serial port connected. See this part of the guide https://github.com/wildmountainfarms/solarthing/blob/master/other/docs/quickstart_rover.md#configuring-the-dummy-file
Import a Dashboard
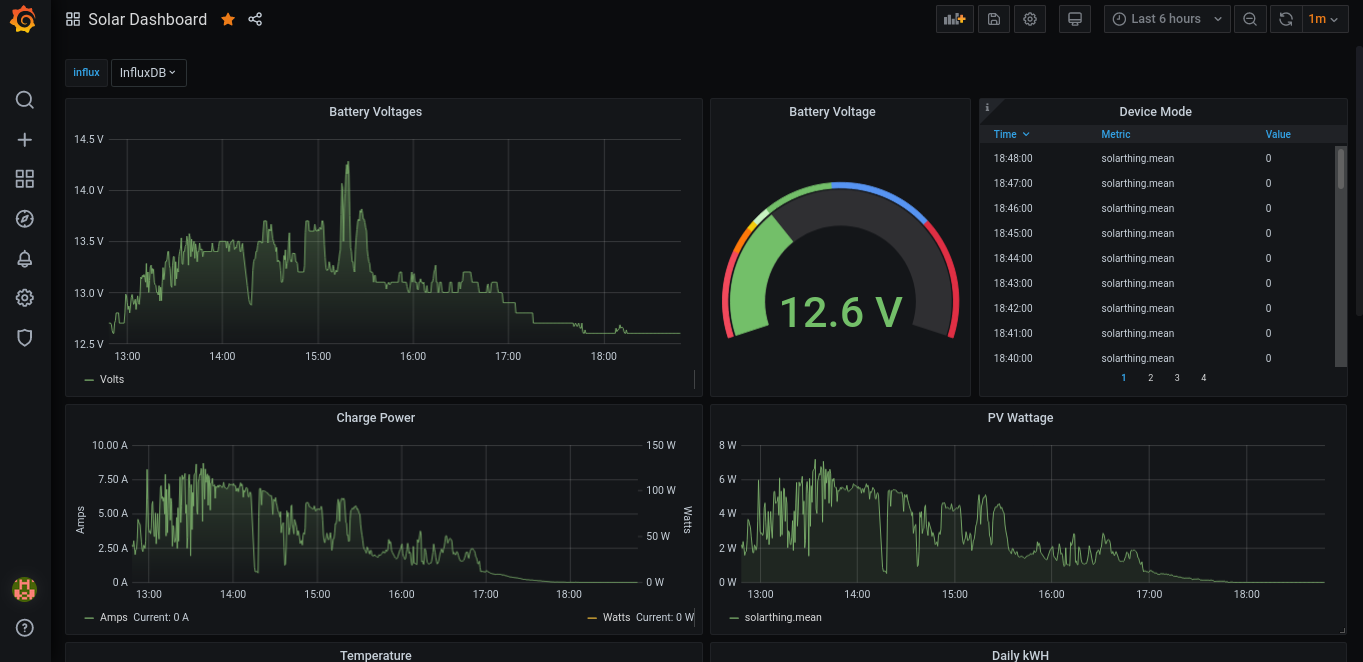
In the SolarThing Repository you will find some dashboards already setup at “other/grafana”. I have added a 12v dashboard here if you are also running a 12v system. It will matter for the “Battery Voltage” panel.
Well
In my position of having 200 watts of solar panels this is no doubt overkill, but it is also super cool and useful. In my van, my desk faces away from my charge controller and inverter. To check where my power was at, I would have to turn around. Well now I can be even lazier. Just open a new tab in the browser with my Grafana dash and I know exactly where I’m at power wise. The Renogy charge controller also measures temperature.
If you don’t mind going through the process of creating your own serial cable (if you are using the Renogy Rover) it’s well worth doing. It would be nice if Renogy sold a custom cable seeing how they use a custom pinout, but until then I hope this guide helped you like the Renogy forums helped me.